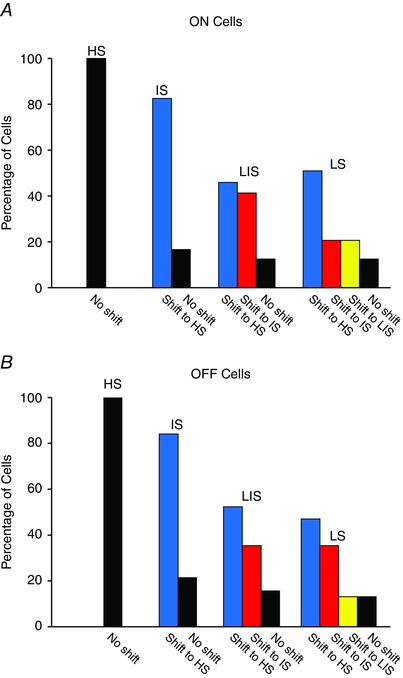
Figure 5. Summary of the sensitivity changes induced by PTX as indicated by shifts in the intensity–response functions of individual cells .

A, application of PTX produced an increase of the threshold sensitivity of almost all IS, LIS and LS ON RGCs. Most shifts in sensitivity of IS and LS cells were to the range normally displayed by HS cells. However, PTX never increased the sensitivity of HS ON cells. B, application of PTX increased the sensitivity of most IS, LIS and LS OFF RGCs. However, as seen for ON cells, PTX did not alter the sensitivity of HS OFF RGCs. [Colour figure can be viewed at wileyonlinelibrary.com]
