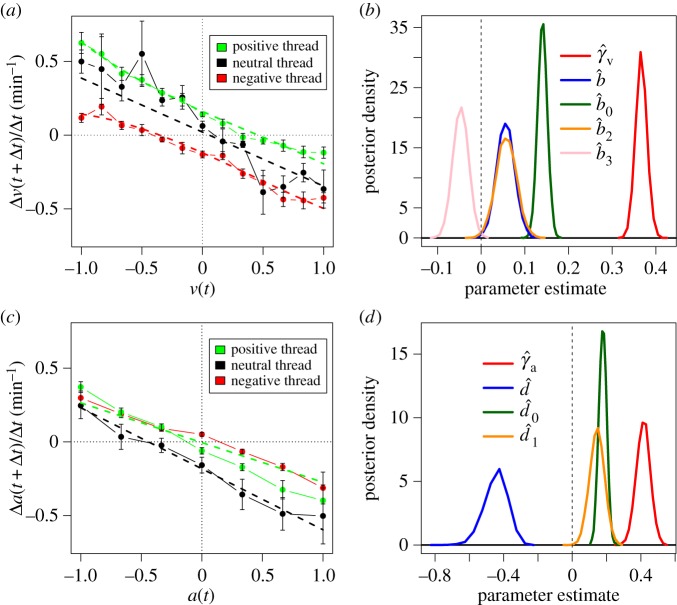
Figure 2.
Mean change in valence (a) and arousal (c) per time unit while reading threads versus the previous reported value. Error bars show standard error, dashed lines show the changes predicted by the model. (b,d) Posterior density function of relevant parameters in valence (b) and arousal (d) dynamics over 10 000 simulations, binned with Sturges' formula [64].

