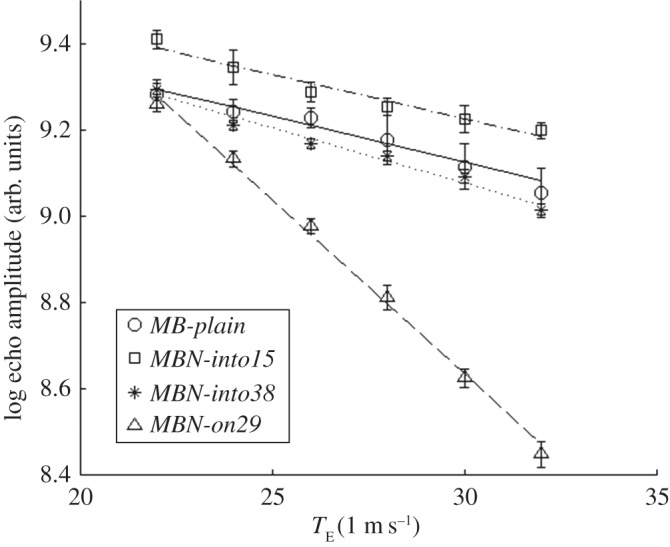
Figure 4.

Logarithm of the echo amplitude (measured values and regression lines) in static T2*-weighted MRI as a function of echo time for the four CAs considered.

Logarithm of the echo amplitude (measured values and regression lines) in static T2*-weighted MRI as a function of echo time for the four CAs considered.