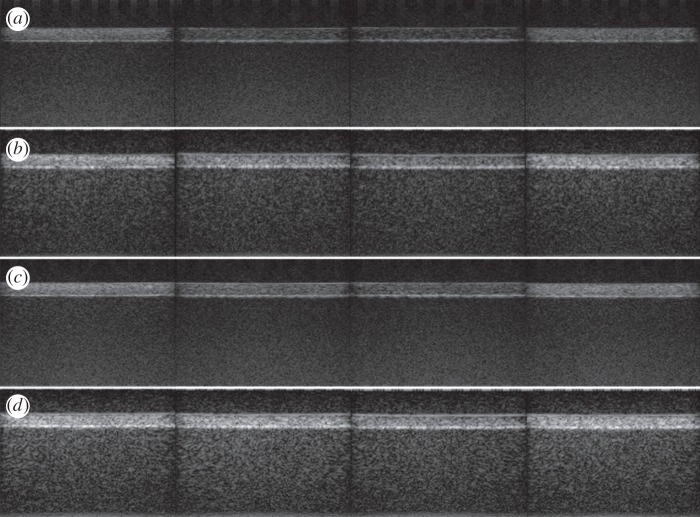
Figure 5.
Ultrasound images of the phantom with the flow channel filled by different CAs, with different combinations of peak pressure and contrast-specific UI techniques. Peak pressure of: (a) 230 kPa and CPS3, (b) 230 kPa and Chirp CPS3, (c) 320 kPa and CPS3 and (d) 320 kPa and Chirp CPS3. From left to right: MB-plain, MBN-into15, MBN-into38 and MBN-on29.

