
Figure 3.
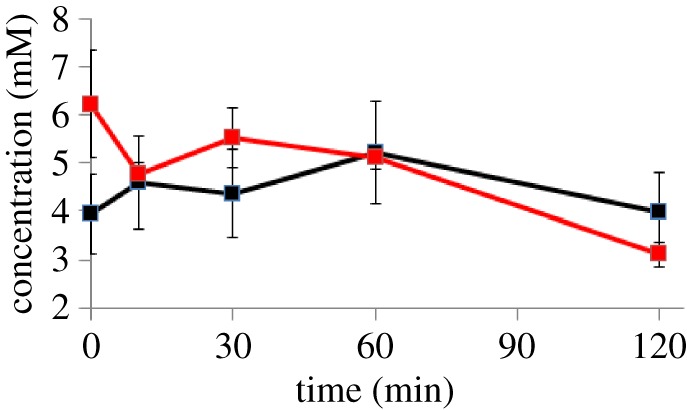
Comparison of intracellular pyruvate concentrations following introduction of oxygen to anaerobic culture, as measured by NMR (black) and using a pyruvate assay (red). Error bars for the assay are the standard deviation from three independent measurements, and for the NMR assay are 20.6% (electronic supplementary material, table S1).