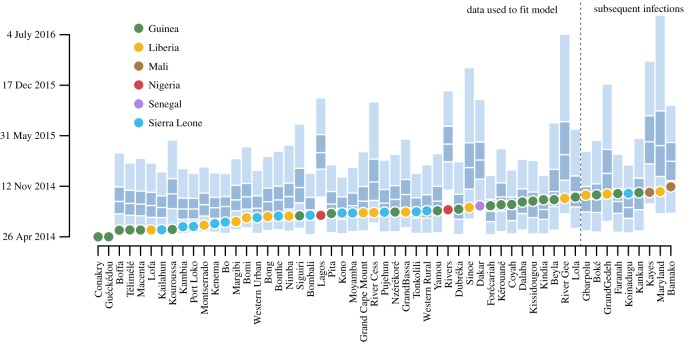
Figure 2.
Predicted day of infection for infected administrative units based on the best-fit model. The predicted day of infection is based on simulations from 24 April. For each node, the 95% prediction interval is in light blue with the interquartile range specified as dark blue and the median infection as a break. Dots represent the observed day of infection coloured by country. Infection locations used in fitting are left of the dotted line and infections subsequent to 1 October are to the right of the dotted line. Observations were within confidence bounds except for the two Nigerian states and the prefecture of Kouroussa in Guinea, which were predicted to become infected later than observed.

