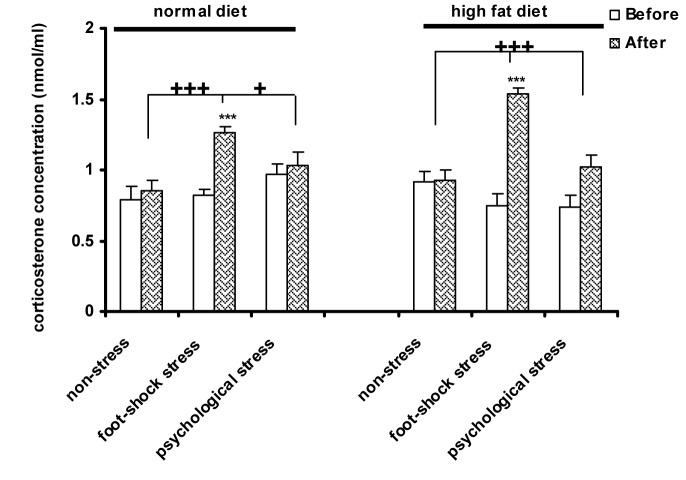
Figure 3. The effect of high-fat diet and stress on plasma corticosterone concentration. Each column represents the mean±SEM of 6 rats.
***P<0.001 significant difference relative to (Before) of each group. +++P<0.01, +P<0.05 significant difference relative to the (After) of the psychological stress and control (non-stress) groups.
Before: Before exposure to stress or being placed in the communication box
After: After exposure to stress or removing from the communication box.

