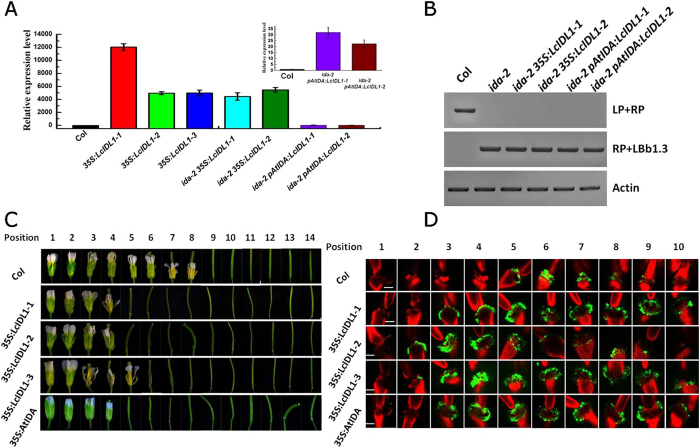
Figure 5. Overexpression of LcIDL1 caused earlier floral organ abscission in Arabidopsis.
(A) Expression level of LcIDL1 in different transgenic Arabidopsis lines. 35S:LcIDL1-1, 35S:LcIDL1-2, and 35S:LcIDL1-3 lines were ectopic expression of LcIDL1 under the control of the 35S promoter in wild type Col; ida-2 35S:LcIDL1-1 and ida-2 35S:LcIDL1-2 lines were ectopic expression of LcIDL1 under the control of the 35S promoter in ida-2; ida-2 pAtIDA:LcIDL1-1 and ida-2 pAtIDA:LcIDL1-2 lines were ectopic expression of LcIDL1 under the control of the Arabidopsis IDA promoter in ida-2. AtUBQ was used as an internal control for qRT-PCR analysis. The Y-axis is fold-change, the expression levels are relative to wild type Col. Data shown are means ± SD. (B) Genotyping analysis of IDA in Col, ida-2, ida-2 35S:LcIDL1-1, ida-2 35S:LcIDL1-1, ida-2 pAtIDA:LcIDL1-1 and ida-2 pAtIDA:LcIDL1-1. The T-DNA insertion mutant ida-2 are analyzed with LP (Left border primer of the T-DNA insertion), RP (Right border primer of the T-DNA insertion), and LBb1.3 (used for Salk genotyping project). (C) Phenotype of floral organ abscission in transgenic lines. Position numbers were counted from the first flower with visible white petals on the top of the inflorescence. (D) BCECF fluorescence micrographs of floral organ AZ of Arabidopsis Col, 35S:LcIDL1-1, 35S:LcIDL1-2, and 35S:LcIDL1-3. Inflorescences were sampled separately, incubated in BCECF solution, and examined by a confocal laser scanning microscope. The microscopic fluorescence images represent merged images of BCECF fluorescence with chlorophyll autofluorescence images. The increase in pH is shown by green fluorescence, which is distinguished from the red chlorophyll autofluorescence. Scale bars are 100 μm in length. The images presented for each plant and positions are representative images out of 3–4 replicates.

