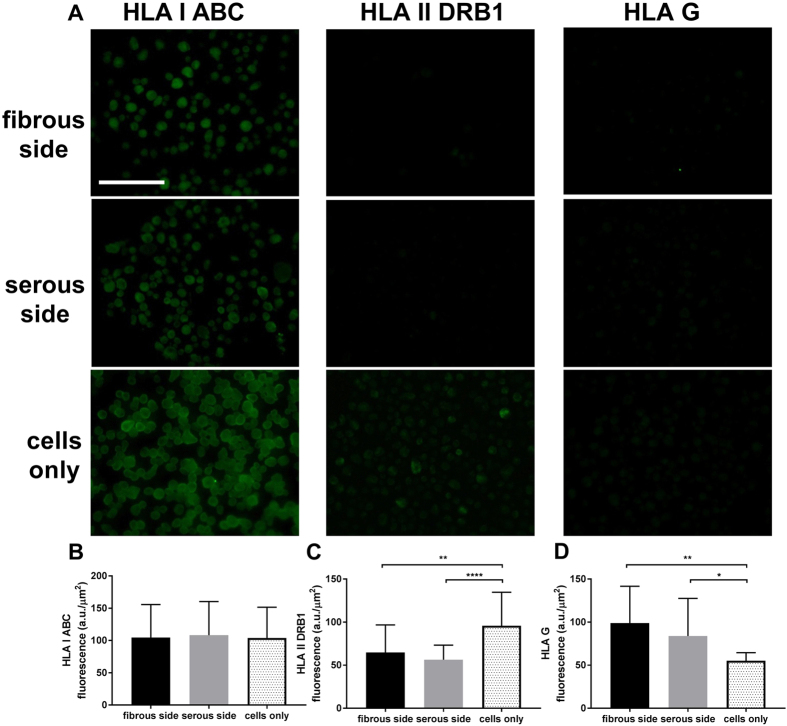
Figure 6. Immunofluorescent staining of HLA class I ABC, HLA class II DRB1 and HLA G proteins in hMSC seeded on fibrous or serous side of ASB-14 scaffold, and tissue culture plastic.
(A) HLA class I ABC proteins were detected in all the MSCs under the different seeding conditions. HLA class II DRB1 was weakly stained in hMSC on plastic, and further reduced in hMSC on ASB-14 scaffolds. HLA G staining was low in hMSC on plastic, and increased following seeding on ASB-14 scaffolds. Scale bar represents 100 μm. (B) No statistically significant difference was observed on HLA class I ABC expression between groups (p > 0.05). (C) Cells on fibrous side (p = 0.0026) and serous side (****p < 0.0001) express significantly less HLA class II DRB1 compared to cells on tissue culture plastic. (D) Cells on fibrous side (p = 0.0014) and serous side (p = 0.0187) express significantly more HLA G compared to cells on tissue culture plastic. Fluorescent intensity is expressed as arbitrary unit (a.u.)/μm2. Data are shown as the mean ± standard deviation (n = 20–30 cells per stain per group).

