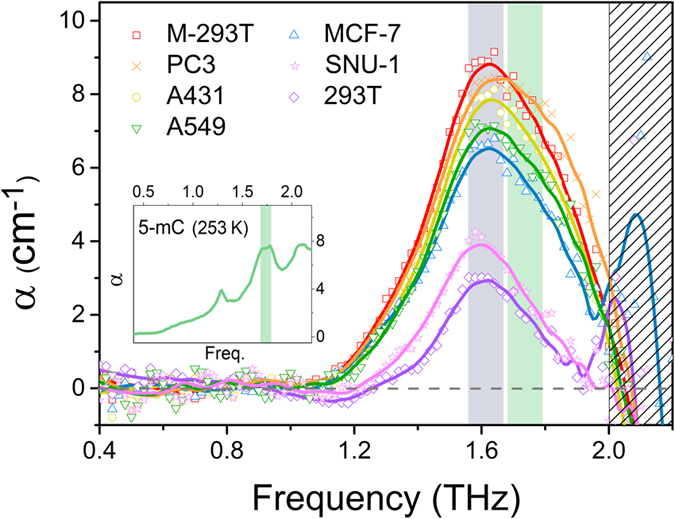
Figure 4. THz resonance peaks for DNA samples after baseline correction.

The first Gaussian function (the absorption coefficient of ice and other buffer materials) of Fig. 3 acts as the baseline for each measured data point. The results were obtained by subtracting the baseline from the measured data at each data point. There is only one resonance peak (~1.67 THz), but its position is similar to the second peak (1.74 THz) for the 5-mC result (emerald line). We attributed the peak shift to interactions with water molecules in aqueous solvent.
