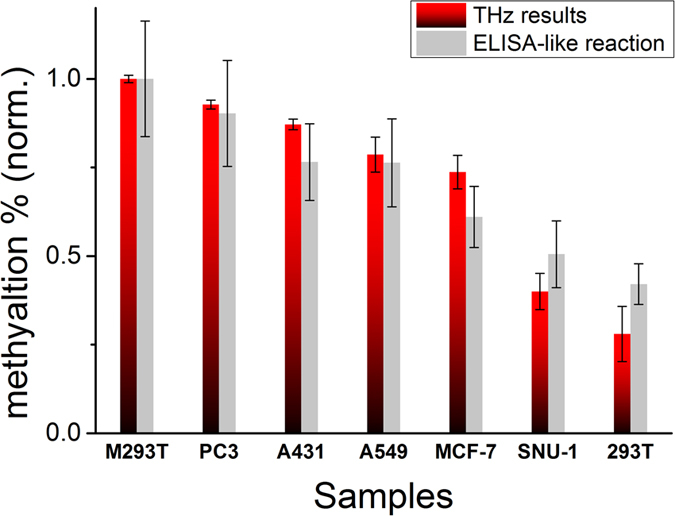
Figure 5. The degree of DNA methylation for each DNA sample.

The results were compared with quantitative data from a commercial biological method (ELISA-like reaction). The data from both methods were normalized based on the degree of the M-293T sample, which had the highest methylation ratio. THz results were quantified by the height of the resonance peak of the baseline-corrected results and baseline values.
