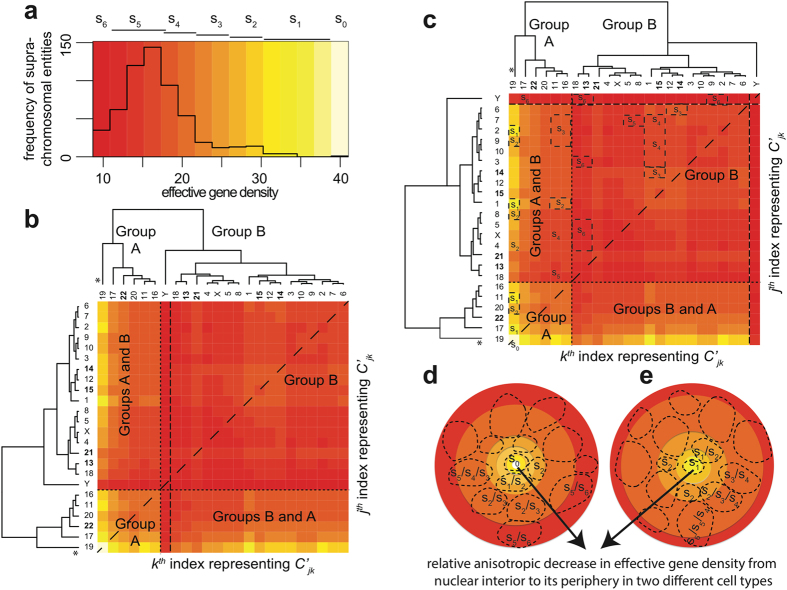
Figure 1. The effective gene density obtained from extrinsic suprachromosomal entities of the human genome.
A histogram of effective gene density from all unique chromosome pairs  is represented in (a). The histogram colour key is encoded at the top of panel (a) as s6/s5 (dark/light red), s4/s3 (dark/light orange), s2/s1 (dark/light yellow) and s0 (off-white) as effective gene density values increase along the x-axis. A hierarchically clustered heatmap of the effective gene density matrix from all
  chromosome pairs indexed by labels j and k on the y- and x-axes respectively is shown in (b). The values of effective gene density from
  and
and  are identical, indicated by a dashed diagonal line, and the horizontal and vertical dashed lines segregate suprachromosomal pairs when both Cj and Ck belong to Group A, or Group B, or their admixture. Here, chromosome Y (denoted chrY, from Group B) is highlighted by two vertical dashed lines, which represent its unique position in the overall hierarchy that is dominated by chromosome 19 (marked “*”). The colour key for effective gene density values in (a, b) are consistent. The five acrocentric CTs: chromosomes 13–15, 21 and 22 are represented with bold labels. Exploiting the degeneracy of chrY, with respect to all other chromosomes of the human genome, a mathematically equivalent heatmap is generated in panel (c). Suprachromosomal entities coloured s0 to s6 gradient in (a) are mapped as boxes in (c). For example, s1 is represented by chr19 paired with chr2/chr1/chr11/chr17, s2 represented by chr19 when paired with chr9/chr8/chr4/chr20 and so on. Similarly, deeper hues from orange to red represent a progressively larger pools of degenerate suprachromosomal pairs with similar effective gene density. Hypothetically, cohorts of suprachromosomal entities s0–s6 may be used to recreate a 3D spherical representation of CT arrangement for cell type-specific human nuclei in a 2D rendition (panels d, e), arranged with relatively high effective gene density contributors such as s0/s1/s2 toward the interior of the nuclei and the relatively low effective gene density contributors such as s6/s5 toward the periphery as indicated by the arrow.

