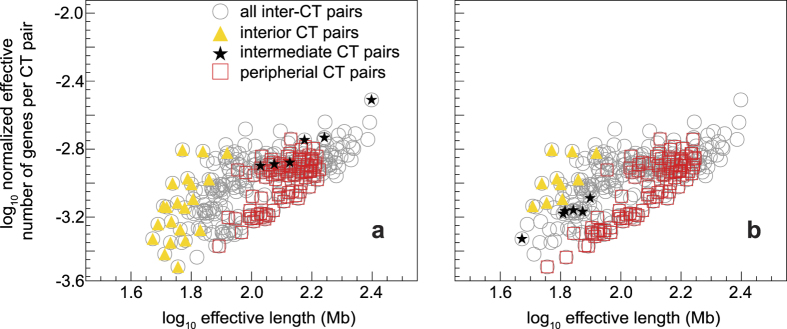
Figure 2. Normalized effective number of genes versus effective length for suprachromosomal pairs.
The graph of normalized effective number of genes (π′jk) for every  pair versus their effective length (L′jk) for all
  is shown as a circle (open circle). Panel (a) represents the preferential CT location data from fibroblast nuclei and (b) represents lymphocyte data. The coordinates representing
  pairs, wherein both CTs are from nuclear interior (triangle), periphery (box), and spatially intermediate (star) regions, are superimposed over those representing all pairs (open circle). The ones shown in the open circle that do not overlap with either a triangle, box, or star, represent those pairs where CTs belong to a different mix of spatial categories. Only unambiguous spatial CT positions from Table S1 are represented.

