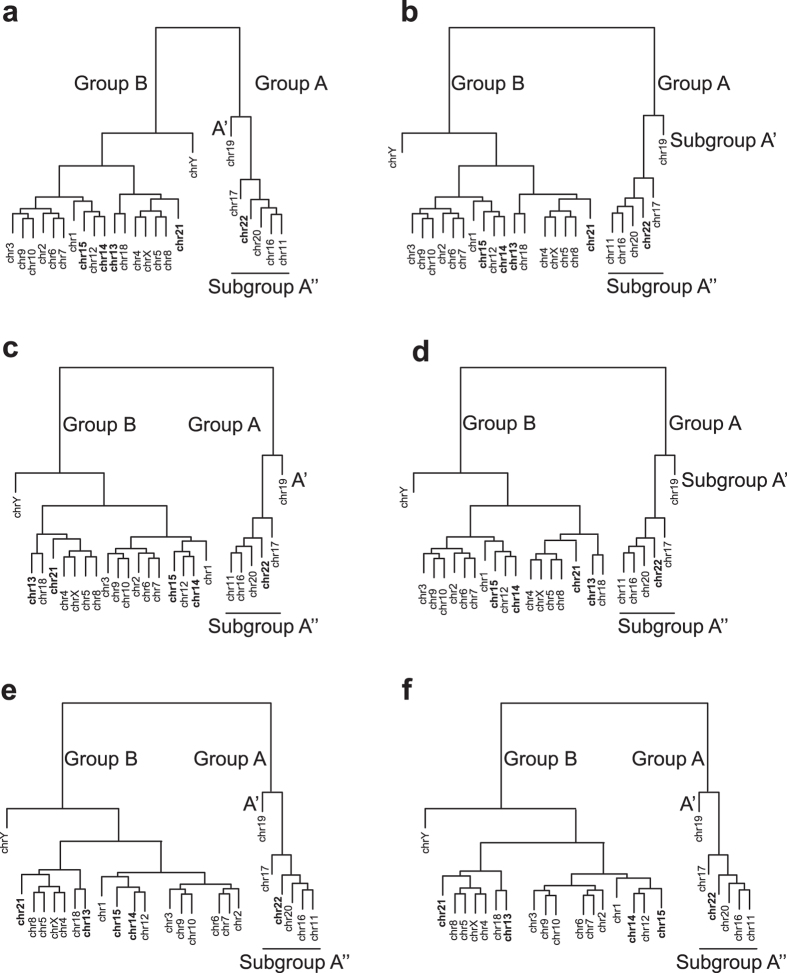
Figure 3. Equivalent hierarchically clustered dendrograms derived from the effective gene density matrix.
The suprachromosomal coupling dendrograms derived from the effective gene density matrix for Homo sapiens (using coding and noncoding genome) represent unique CT constellations in (a–f). These six unique CT constellations can be perceived on an abstract 2D plane by consigning chr19 (human chromosome 19) to the nuclear interior, as in (a–f). The vertical line connotes hierarchy in the effective gene density whose length relates to diversity in suprachromosomal organization as elaborated below. Chr3 placed at the end of multiple branch-points of the dendrogram with respect to chr19 is considered “distant” in the vertical axis as compared to chrY vis-á-vis chr19. The horizontal branch connotes a mother/daughter hierarchical relationship via branch-points (representing CTs) within a given clade, and therefore their absolute lengths have no physical implication where clades may even be revolved around the primary anchorage point defined by chr19 or around other subordinate branch points, thereby giving rise to equivalent dendrograms (a–f) and representing the plasticity associated with suprachromosomal organization. Similarly, the vertical line connotes hierarchy in the effective gene density whose length relates to diversity in suprachromosomal organization. As in a hypothetical situation, interior and peripheral CTs are denoted as Groups A and B respectively (see Fig. 1). Although chr21 and chrY are Group B CTs and relatively gene poor, the theory supports a constellation with them as interior chromosomes due to neighbourhood CT effects (a). A hierarchical and degenerate representation enables the rationalization of chr21 and chrY as interior CTs shown in panel (a) (such as in fibroblasts), versus peripheral CTs in (b) (such as in lymphocytes).

