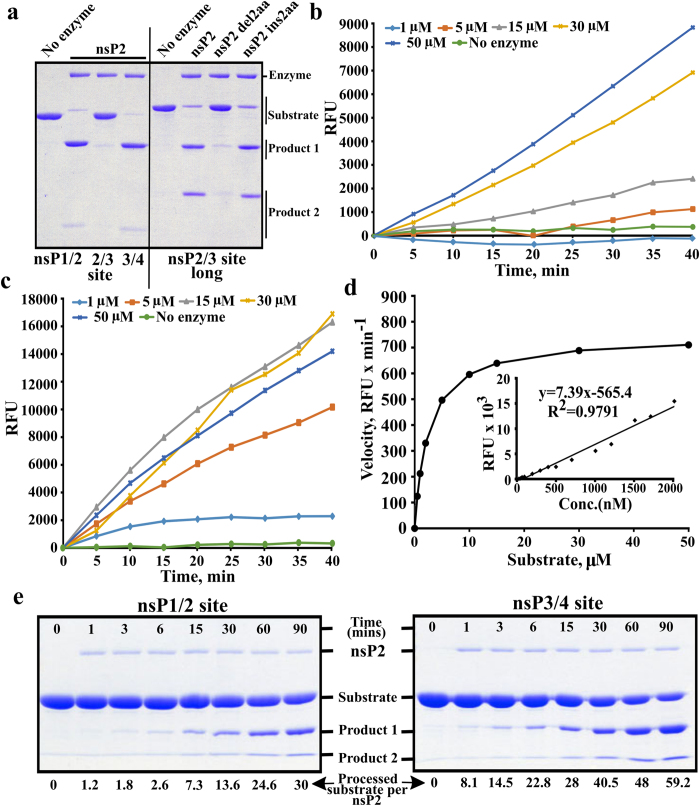
Figure 1. Processing of different substrates by CHIKV nsP2.
(a) Processing of recombinant protein substrates. Reaction mixtures were incubated for 60 min and reaction products were resolved using 12% SDS-PAGE. Substrates contained either short (10:5) peptides originating from 1/2, 2/3 and 3/4 sites (left side of the panel) or a longer (10:170) region representing 2/3 site and macro domain of nsP3 (right side of the panel). Enzymes used to perform cleavage are shown above the panel. (b) Processing of Short peptide substrate. The concentration of nsP2 was kept constant (78 nM) while concentration of the substrate ranged from 1 to 50 μM (shown above graphs); in the control reaction 15 μM of substrate was incubated without the enzyme. The fluorescence resulting from cleavage is shown as the function of time. (c) Processing of Long peptide substrate. The experiment was performed as in panel b. (d) Enzyme kinetic constant Km was derived by plotting the initial reaction velocity on vertical axis against increasing Long peptide substrate concentration (0.5, 1, 2, 5, 10, 15, 30, 50 μM) on horizontal axis. Inset: representative plot of EDANS fluorescence generated by treating increasing concentrations of Long peptide substrate with proteinase K (50 μg per reaction). (e) Processing kinetics of wt nsP2 revealed using recombinant protein based substrates. Wt nsP2 was mixed with substrates corresponding to 1/2 (left panel) and 3/4 (right panel) sites using molar ratio 1:100. Reactions were carried out at 30 °C; aliquots were collected at 0 (before adding enzyme), 1, 3, 6, 15, 30, 60 and 90 min, and analysed using 10% SDS-PAGE. ImageJ program (NIH, USA) was used to quantify substrate band intensities. The values were further analysed using MS Excel software and expressed as pmol of processed substrate per pmol of nsP2 as indicated at the bottom of the figure. All experiments were repeated at least twice; data from one of reproducible experiment is shown.

