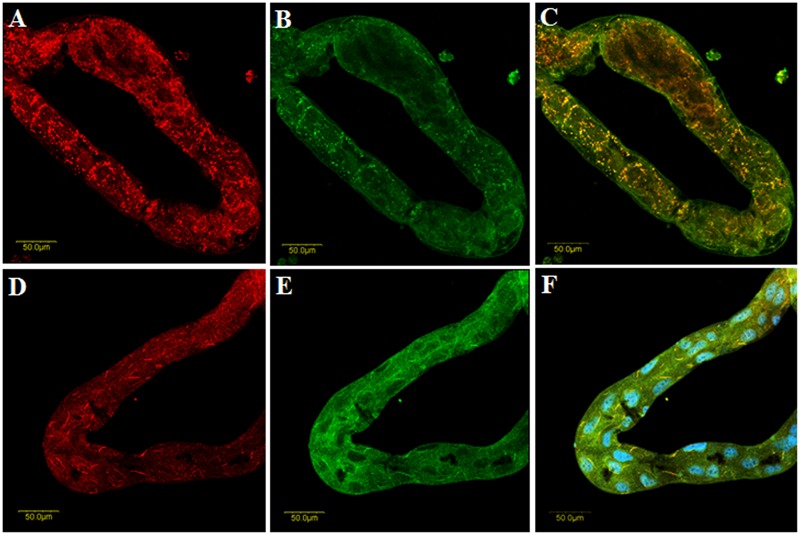
FIGURE 8.

Colocalization of TYLCV (A, red) and CypB (B, green) in midguts dissected from VBt fed on 25% sucrose. (C) Shows the yellow spots where CypB and TYLCV co-localize. (D) Shows immunolocalization of TYLCV after feeding with the CypB inhibitor CsA and (E) Shows immunolocalization of CypB after feeding with the CsA inhibitor. (F) Is an overlay of (D and E). Blue is DAPI staining of the nuclei.
