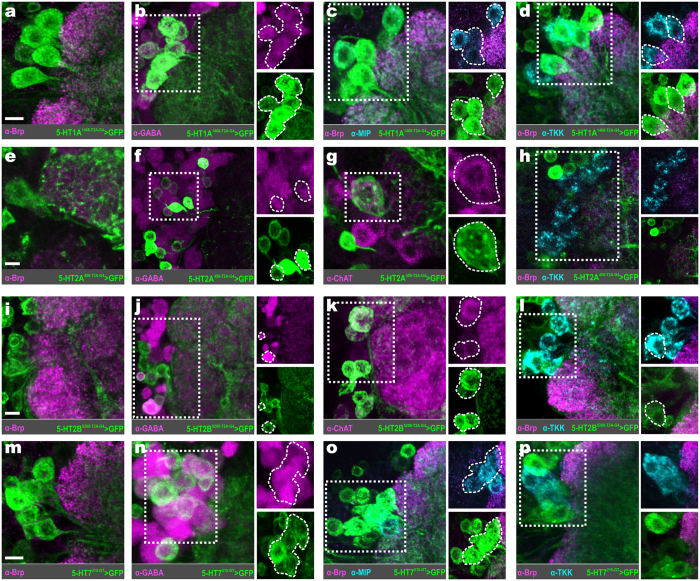
Figure 5. 5-HTRs are expressed by distinct populations of local interneurons.
(a) Local interneurons (LNs) that express 5-HT1A. (b) 5-HT1A LNs (green) colabel for GABA (magenta). (c) 5-HT1A LNs (green) colabel for myoinhibitory peptide (MIP; cyan). (d) 5-HT1A LNs colabel for tachykinin (TKK; cyan). (e) 5-HT2A expressing LNs (green). (f) 5-HT2A LNs (green) colabel for GABA (magenta). (g) Cholinergic LNs (ChAT; magenta) express 5-HT2A. (h) 5-HT2A (green) is not expressed by any TKKinergic LN (cyan). (i) LNs that express 5-HT2B. (j) 5-HT2B LNs (green) colabel for GABA (magenta). (k) Cholinergic LNs (ChAT; magenta) express 5-HT2B. (l) 5-HT2B (green) is expressed by TKKinergic LNs (cyan). (m) 5-HT7 expressing LNs. (n) 5-HT7 LNs colabel for GABA (magenta). (o) 5-HT7 LNs colabel for MIP (cyan). (p) 5-HT7 LNs colabel for TKK (cyan). Neuropil in (a), (c–e), (i), (l), (m), and (o,p) are delineated by α-Bruchpilot (α-Brp; magenta) labeling. All scale bars = 10 um.

