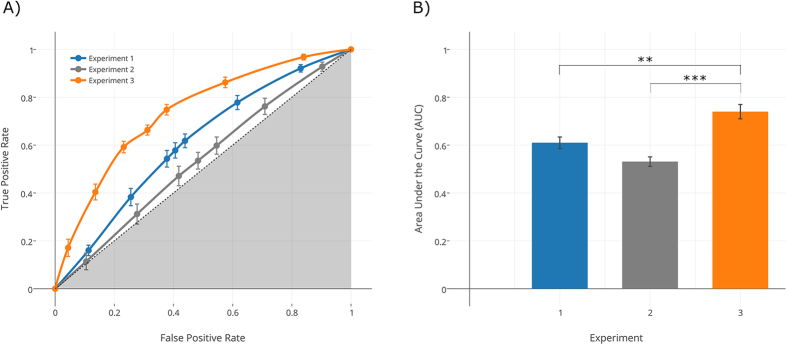
Figure 1. Classification of intention from movement kinematics.
Panel (A) The 7-points ROC curves derived from participants’ ratings show probability of true positive rate (hit) versus false-positive rate (false alarm) for grasp-to-pour and grasp-to-drink movements in Experiment 1 (blue), Experiment 2 (gray), and Experiment 3 (orange). The discrimination ability increases as the ROC curve moves from the diagonal (dashed line corresponding to 0.5 random guess performance) towards the upper left boundary of the graph (1.0 perfect performance). Panel (B) Statistical comparisons between AUC values for Experiment 1, 2, and 3. AUC was significantly greater for participants exposed to movements for which the model predicted a higher classification accuracy (Experiment 3) compared to both Experiment 1 (p = 0.001) and Experiment 2 (p < 0.001). No difference emerged from the comparison between Experiments 1 and 2 (p = 0.105). Bonferroni correction was applied to post hoc comparisons.

