-
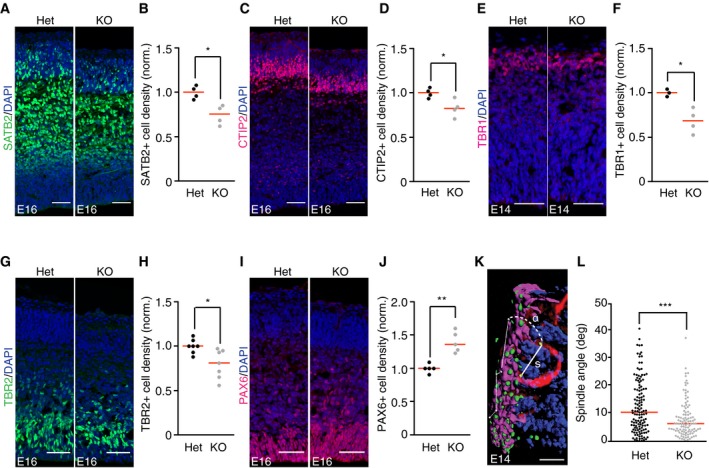
A, B
Confocal images of coronal sections from E16 brains of miR‐34/449 KO mice and littermate controls (Het), stained with anti‐Satb2‐antibody to label neurons of layers II–IV (green) and DAPI to label all cell nuclei (blue). Quantification of the number of Satb2‐positive cells per 100 μm ventricular zone surface (n = 4 brains per genotype group, 2 independent litters). *P‐value = 0.01146 (Het vs. KO).
-
C, D
Confocal images of coronal sections from E16 brains of miR‐34/449 KO mice and littermate controls (Het), stained with anti‐Ctip2 antibody to label V neurons and DAPI to label all cell nuclei (blue). Images were taken from same brain slices as shown in (A). Scale bars: 50 μm. Quantification of the number of Ctip2‐positive cells per 100 μm ventricular zone surface (n = 4 brains per genotype group, 2 independent litters). *P‐value = 0.03224 (Het vs. KO).
-
E, F
Confocal images of coronal sections from E14 brains of miR‐34/449 KO mice and littermate controls (Het), stained with anti‐Tbr1 antibody to label layer IV neurons and DAPI to label all cell nuclei (blue). Quantification of the number of Tbr1‐positive cells per 100 μm ventricular zone surface (n = 3 and 4 brains per genotype group from 2 independent litters). *P‐value = 0.01392 (Het vs. KO).
-
G, H
Confocal images of coronal sections from E16 brains of miR‐34/449 KO mice and littermate controls (Het), stained with anti‐Tbr2 antibody to label intermediate progenitors and DAPI to label all cell nuclei (blue). Quantification of the number of Tbr2‐positive cells per 100 μm ventricular zone surface (n = 7 brains for each genotype group, 5 independent litters). *P‐value = 0.01647 (Het vs. KO).
-
I, J
Confocal images of coronal sections from E16 brains of miR‐34/449 KO mice and littermate controls (Het), stained with anti‐Pax6 antibody to label radial glia progenitors and DAPI to label all cell nuclei (blue). Quantification of the number of Tbr2‐positive cells per 100 μm ventricular zone surface (n = 5 brains per genotype group, 3 independent litters). **P‐value = 0.002768 (Het vs. KO).
-
K
3D reconstruction of a dividing radial glial progenitor at early anaphase. A coronal section of an E14 brain of a heterozygous control mouse was stained with anti‐phospho‐vimentin antibody (red), anti‐γ‐tubulin antibody (green/yellow), phalloidin (magenta), and DAPI (blue) and imaged by 3D confocal microscopy. “s” indicates spindle axis, and “α” indicates angle relative to ventricular surface plane, which was determined by a vector path as indicated by thin white lines located on the left side of the image. Yellow dots highlight the centrosomes of the spindle poles from the analyzed dividing cell.
-
L
Quantification of spindle orientation in radial glial cells as in (K) for E14 brains of miR‐34/449 KO and littermate controls (Het). Each dot represents a single dividing cell; ***P‐value = 3.166e‐05 (Het vs. KO) (n = 131 vs. 107 cells, n = 4 brains per genotype group, 2 independent litters).
Data information: Scale bars: 50 μm (A, C, E, G, I) and 5 μm (K). Bars indicate mean ± SEM. Data were normalized (norm.) to the ventricular zone surface analyzed (100 μm) and relativized to the heterozygous control average value. Statistical significance was tested by Welch's
‐test.