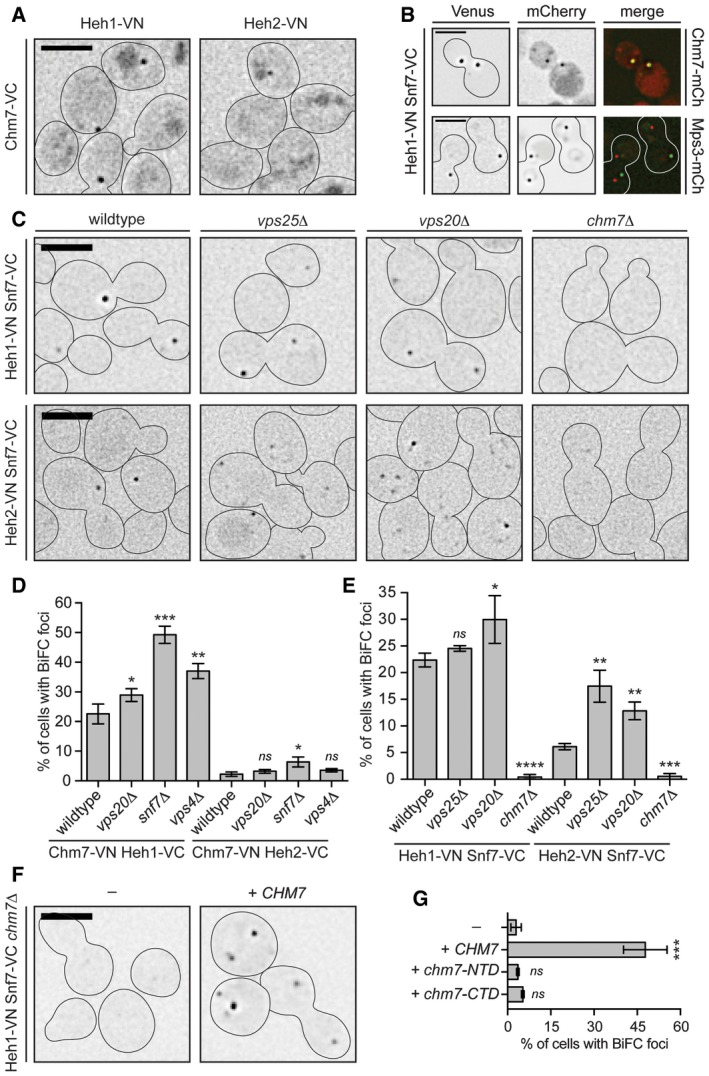
Figure 4. Heh1‐Chm7 interactions occur at the NE subdomain.

-
ADeconvolved inverted fluorescence micrographs of BiFC signal of Chm7‐VC with either Heh1‐VN or Heh2‐VN. Cell borders are outlined. Scale bar is 5 μm.
-
BDeconvolved inverted fluorescence micrographs of yeast strains expressing Heh1‐VN and Snf7‐VC with either Chm7‐mCherry or Mps3‐mCherry and merge of both channels. Scale bar is 5 μm.
-
CDeconvolved inverted fluorescence micrographs of BiFC signal of the indicated VN and VC fusions in the indicated strains. Cell borders are outlined. Scale bar is 5 μm.
-
D, EPlots of the percentage of cells with BiFC signal of the indicated VN VC pairs in the indicated null backgrounds. Data are from three independent replicates where > 225 cells per strain per replicate were quantified. Error bars are SD from the mean of each replicate. P‐values from unpaired Student's t‐test where ns is P > 0.05. *P ≤ 0.05; **P ≤ 0.01; ***P ≤ 0.001; ****P ≤ 0.0001.
-
FDeconvolved inverted fluorescence micrographs of Heh1‐VN Snf7‐VC BiFC signal in a chm7Δ strain with either an empty plasmid (−; pRS416) or a plasmid expressing CHM7 (pRS416‐HA‐chM7). Cell borders are outlined. Scale bar is 5 μm.
-
GPlot of the percentage of cells with BiFC signal from (F). Error bars are SD from the mean of each replicate. P‐values from unpaired Student's t‐test where ns is P > 0.05. ***P ≤ 0.001.
