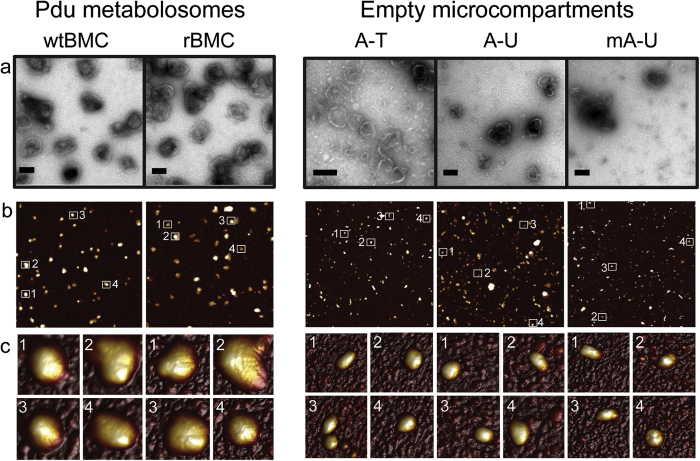
Figure 3. Comaprison and TEM and AFM images of isolated BMCs.
(a) TEM images of purified wtBMCs, rBMCs and eBMCs (A-U, mA-U and A-T). The scale bars represent 100 nm. (b) Overview of zoomed-in 4 × 4 μm height AFM scans. White squares represent microcompartment particles shown in Fig. 3c. (c) 3D topology images of single zoomed in particles (240 × 240 nm each) from (b).

