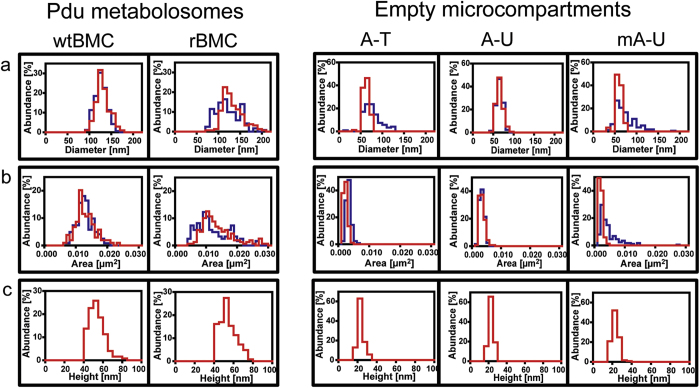
Figure 4. Comparative representation of diameter, area and height distributions of wtBMC, rBMC and eBMCs (A-T, A-U, mA-U).
(a) Diameter distribution of normalized data of TEM (blue) and AFM (red), bin size is 10 nm. (b) Area distribution of normalized TEM (blue) and AFM (red) data, bin size is 0.001 μm2. (c) Height distribution of normalized AFM data, bin size is 5 nm.

