
Figure 3.
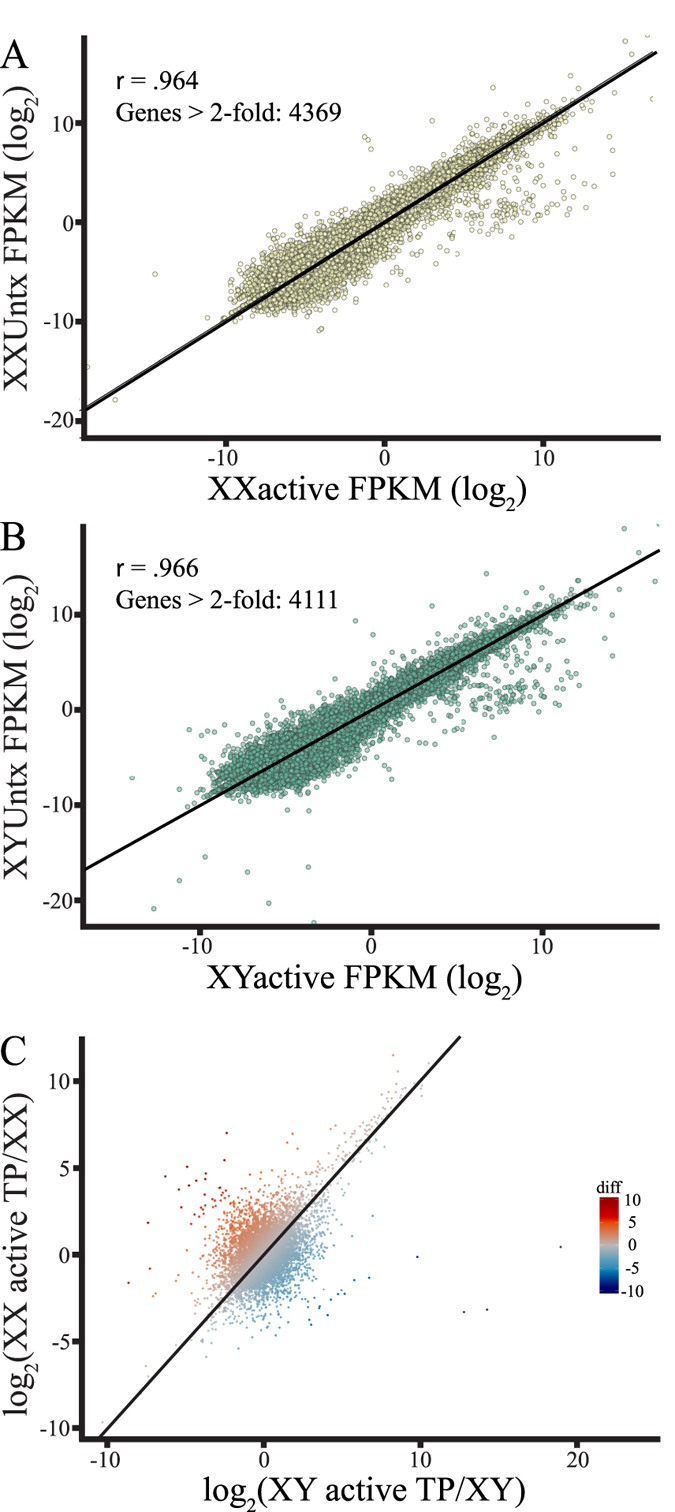
(A,B) A distribution of global XX or XY baseline gene expression compared (Y-axis) to XX or XY gene expression in the presence of 20 nM testosterone propionate (X-axis). (C) Distribution ratios comparing the effects of chromosomal sex and testosterone on global gene expression of XX in TP/baseline gene expression (Y-axis), versus global gene expression changes due to testosterone of XY in TP/baseline gene expression (X-axis).