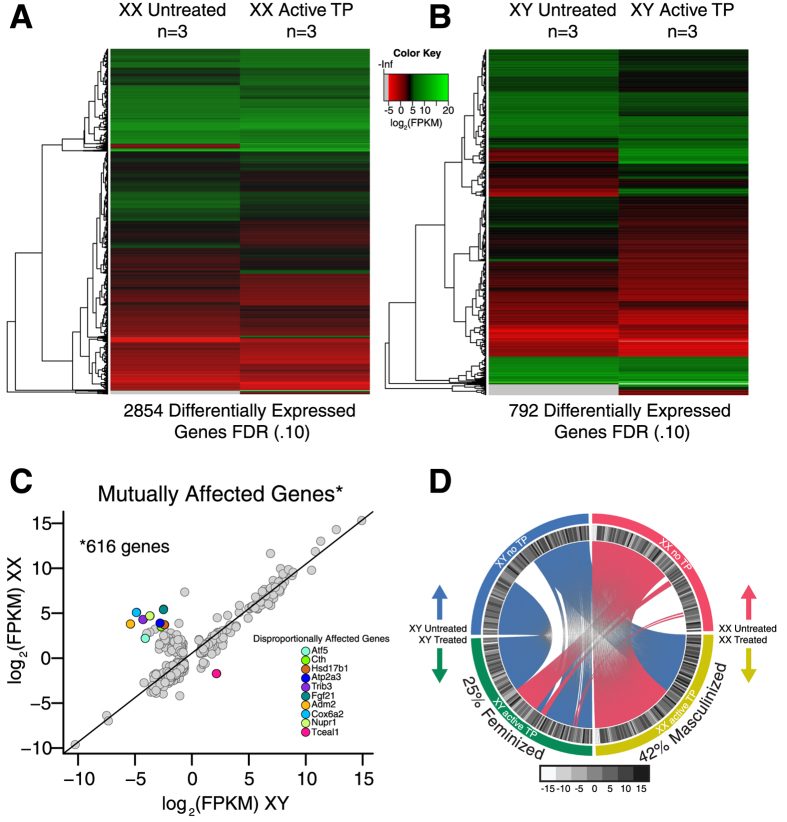
Figure 4.
(A) Heat map representation of the 2854 genes that were differentially expressed on an XX background after exposure to testosterone using a FDR = 0.10, genes are clustered based on similar degrees of differential expression. (B) Heat map representation of the 792 differential expressed transcripts on an XY background in the presence of testosterone using a FDR = 0.10, genes are clustered based on similar degrees of differential expression. (C) Dot plot representation of the delta log2 FPKM expression values for the 616 mutually affected genes on both XX and XY backgrounds. (D) Circos plot representation showing the direction of masculinization or feminization of the 103 genes that were identified to be differentially expressed between XX and XY eNSCs at baseline. Genes connected by pink indicate that those genes either became or maintained a female typical expression pattern in the presence of TP. If the genes are connected by blue, this indicates that those genes either became or maintained a male-typical pattern of gene expression in the presence of TP.

