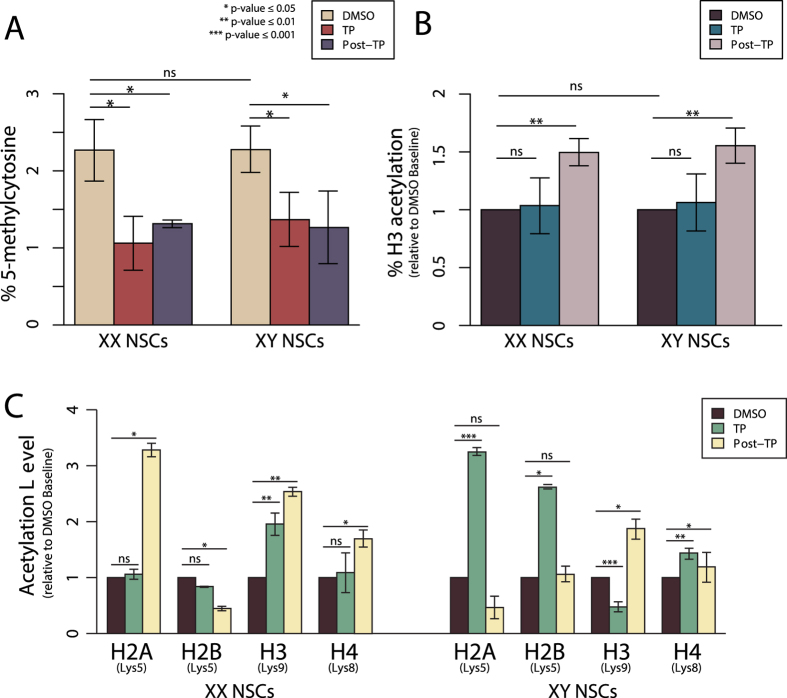
Figure 5.
(A) Global 5-methylcytosine analysis of XX and XY eNSCs pre TP exposure, during TP exposure and within the daughter cells post-TP exposure. (B) Global Histone H3 acetylation analysis of XX and XY eNSCs pre-TP exposure, during TP exposure and within the daughter cells post-TP exposure. (C) Bar plot representation of residue-specific western blot analysis assessing acetylation abundance during active exposure to TP and within the daughter cells post-TP exposure relative to their corresponding control (DMSO) populations which have been set to a value of 1.

