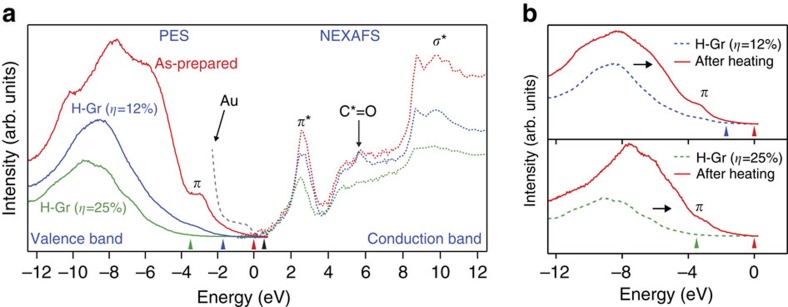
Figure 1. Evolution of the electronic band structure of hydrogenated monolayer graphene (H-Gr) at 300 K.
(a) PES and NEXAFS spectra of graphene and H-Gr. Red, blue and green arrows indicate the valence-band maximum of as-prepared graphene, H-Gr (η=12%) and H-Gr (η=25%), respectively. Black arrow means the shift of the conduction band of both H-Gr (η=12%) and H-Gr (η=25%). The band gap was tunable up to 3.9 eV by the change of hydrogen coverage η. (b) Recovery of the π orbital of graphene in PES spectra after annealing of H-Gr in vacuum at 550 K for 2 h.

