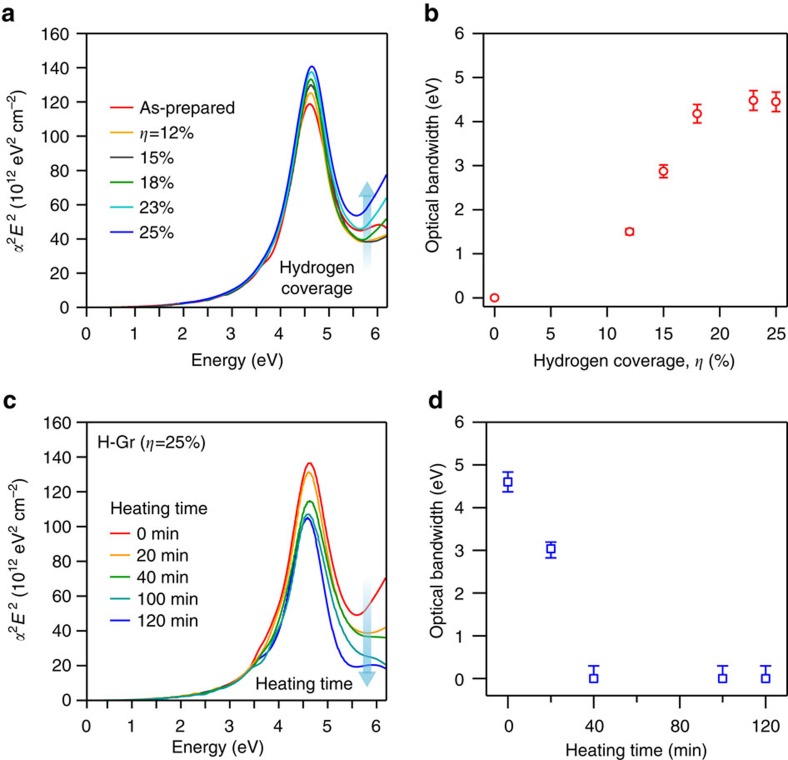
Figure 2. Optical bandwidth and reversibility of H-Gr at 300 K.
(a,b) The evolution of optical (near infrared, visible and ultraviolet) absorption spectra of graphene and H-Gr and their estimated bandwidths as a function of hydrogen coverage η. In the figure, α is the optical absorption coefficient and E is the incident photon energy. The zero optical bandwidth indicates the screening of interband tails by exciton resonance. (c,d) The full recovery of the optical absorption spectra and bandwidths of H-Gr (η=25%) retuning to the pristine graphene state after thermal treatment at 550 K under Ar atmosphere as a function of annealing time. The error bars correspond to ±0.5% uncertainty in the measurement of optical transmission acquired by spectrophotometry.

