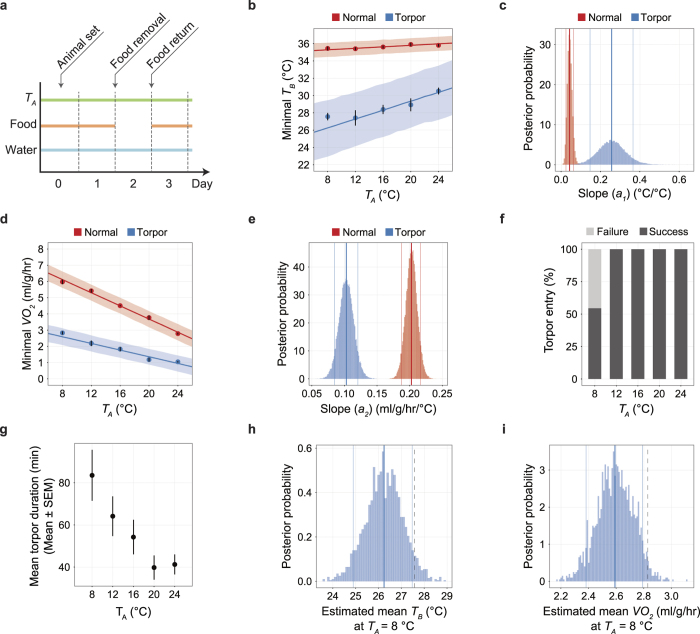
Figure 4. Body-temperature homeostasis is actively controlled during daily torpor.
(a) Protocol of the fasting-induced daily torpor experiment. Animals were placed in the TA-constant chamber on Day 0; data were recorded for 72 hours from the beginning of Day 1. Food was removed and returned at the beginning of Day 2 and Day 3. Water was freely accessible throughout the experiment. (b) The minimum TB at various TAs. Including the following panels, red and blue denote normal and torpid status, respectively. For normal status, the minimum TB of the dark phase of Day 1 was used for analysis. For torpid status, the minimum TB during torpor was used for analysis. As in the following panel d, the dots with the vertical error bars denote the observed mean and SEM of the minimum variables (TB in b, VO2 in d) at each TA, and the line and the shaded area denote the mean and the 89% HPDI intervals of the estimated minimum variables. (c) The posterior distribution of the slope (a1) of TA−TB relationship. Including the following distribution panels in this figure, the bold and thin lines denote the mean and the 89% HPDI intervals of the estimated values. The bin size is 0.005. (d) The minimum VO2 at various TAs. Minimum VO2 was defined as the VO2 recorded when the TB was minimum. (e) The posterior distribution of the slope (a2) of TA-VO2 relationship. The bin size is 0.001 ml/g/hr/°C. (f) The rate of successful daily torpor induction at various TAs. When TA was above 12 °C, all animals entered daily torpor. (g) The averaged torpor duration for each episode. One torpor episode is tended to be shorter when the TA gets higher. (h, i) The posterior distribution of the estimated mean (n = 6) of TB (h) and VO2 (i) at a TA of 8 °C. Because the observed mean (dashed lines) is larger than the 89% HPDI in both TB and VO2, when TA = 8 °C, the animal exhibited higher metabolism than expected. The bin size is 0.1 °C and 0.01 ml/g/hr for TB and VO2, respectively.

