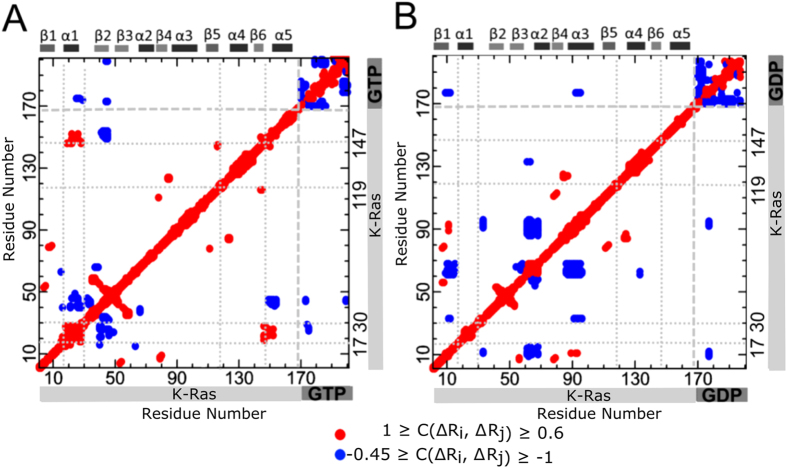
Figure 3. Cross-correlation coefficient maps for GTP and GDP bound states.
Red dots show positive correlations (1 ≥ C(ΔRi, ΔRj) ≥ 0.6) and blue dots show negative correlations (−0.45 ≥ C(ΔRi, ΔRj) ≥ −1). Residues indices 1–169 refer to K-Ras. (A) Correlated fluctuations of K-Ras-GTP. Indices between 170–201 refer to GTP heavy atoms (182–201 are guanine atoms). (B) Correlated fluctuations of K-Ras-GDP. Indices between 170–197 refer to GDP heavy atoms (178–197 are guanine atoms).

