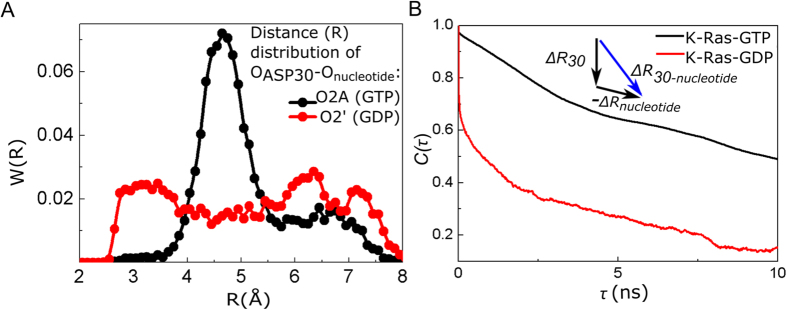
Figure 4. D30-GTP distance is more stable than that of D30-GDP.
Fluctuations of D30(O) to GTP(O2A) “connectivity vector” are persistently correlated. (A) Distance distribution between D30 and connecting O atoms of GTP (black) and GDP (red) (B) Time delayed autocorrelations for the vector connecting Oxygen atom of D30 to O2A of GTP (black curve) and O2’ of GDP (red curve). X-axis is the time delay (τ) and Y-axis is the time delayed autocorrelation of the vector for τ.

