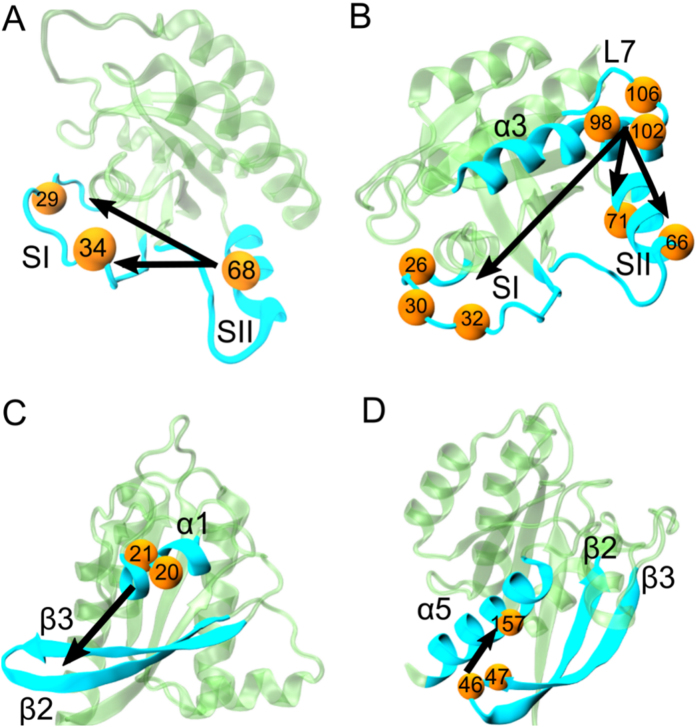
Figure 6. Causality relations in active K-Ras motions.
Directionality in causal relationships is illustrated with arrows. Arrows start from driver residues and end at follower residues. Both residue types are represented with yellow spheres and marked with their residue numbers. The secondary structures they belong to are in turquoise. (A) R68 (SII) drives V29 and P34(SI). (B) E98 and R102 (α3) drive A66 (α2; SII). S106 (L7) drives Y71 (α2; SII). R102 (α3) drives N26 and Y32(SI). S106 (L7) drives D30. (C) ILE21-GLN22 (α1) drives β2-β3. (D) I46 and D47 (β2-β3) drive Y157 (α5).

