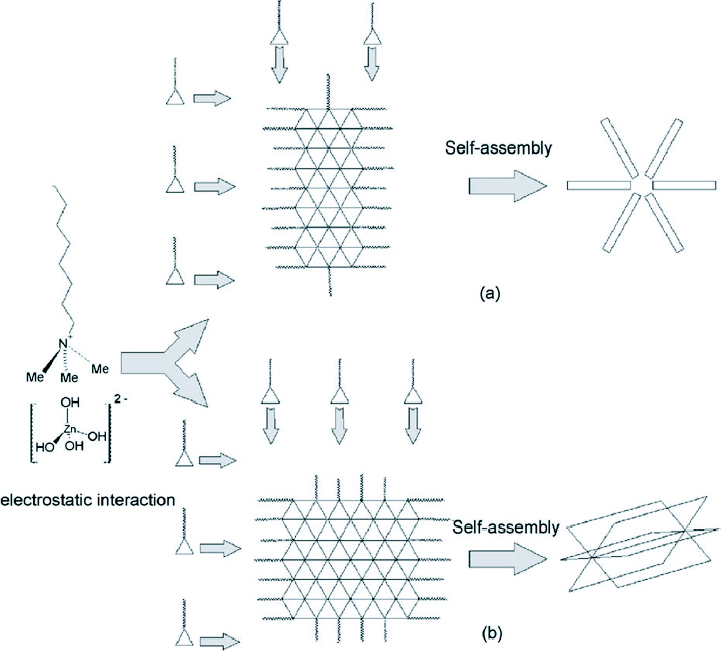
Figure 15.

Schematic illustration explaining the growth of ZnO micro and nanostructures synthesized through CTAB-assisted hydrothermal process at different temperatures (a) 120 °C and (b) 150 °C and 180 °C. (Reproduced with permission from [81] © 2008 Elsevier.)
