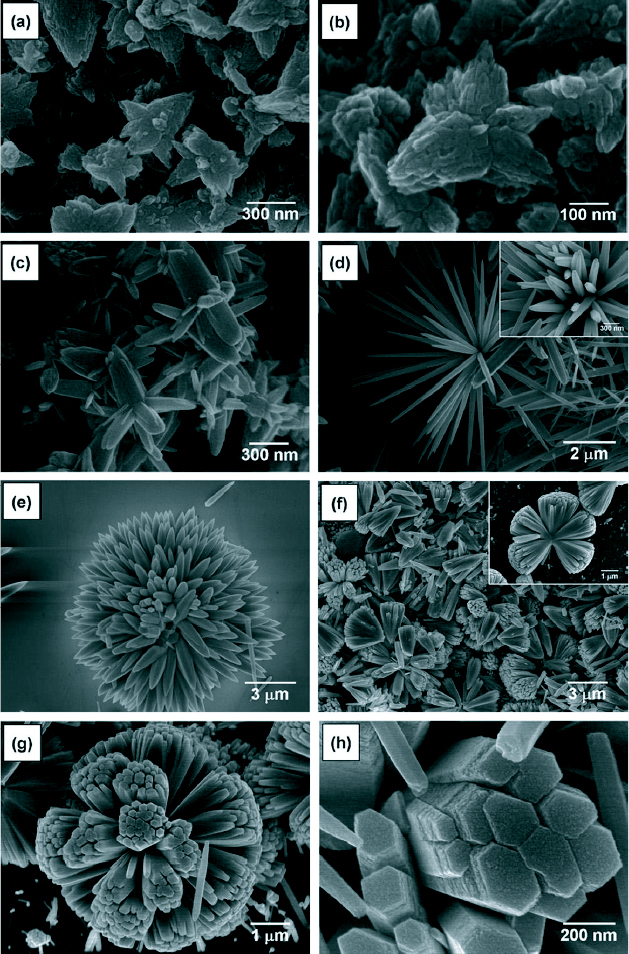
Figure 16.

SEM images of the ZnO 3D nanostructures synthesized at different pH: (a) pH 9.0, (b) pH 9.5, (c) pH 10.0, (d) pH 10.5, (e) pH 11.0, (f) pH 11.5, (g) pH 11.8 and (h) magnified image of pH 11.8. (Reproduced with permission from [82] © 2008 Elsevier.)
