
Fig. 1.
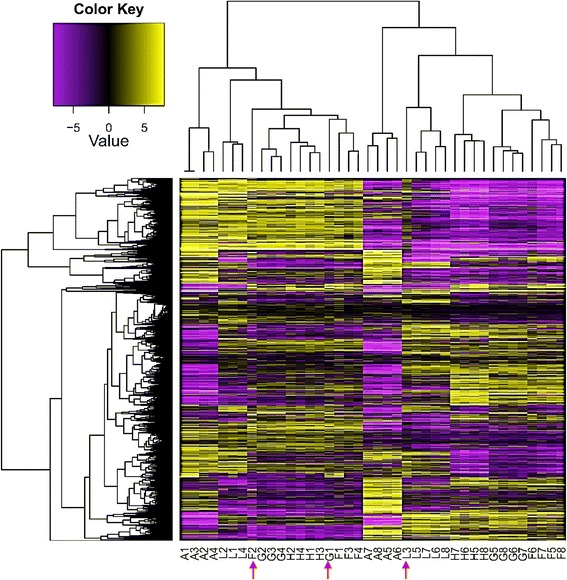
Hierarchical cluster analysis of gene expression based on log ratio RPKM data for transcriptome of R. stricta SRA database in the apical (A1-L4) and mature leaves (A5-L8) at different time points of the day (A, morning; F-H, midday & L, dusk). Red arrows indicate the misplaced samples in the cluster analysis