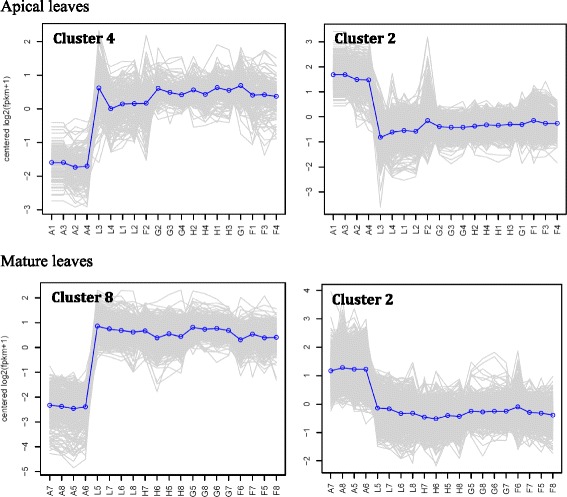
Fig. 2.

Selected clusters of up or downregulated genes of R. stricta from apical (A1-L4) and mature (A5-L8) leaves at different time points of the day (A, morning; F-H, midday and L, dusk). Clusters 4 and 2 of apical leaves = up and downregulation starting midday, respectively. Clusters 8 and 2 of mature leaves = up and downregulation starting midday, respectively. Blue lines indicate overall expression pattern across different transcripts of a given cluster
