
Fig. 4.
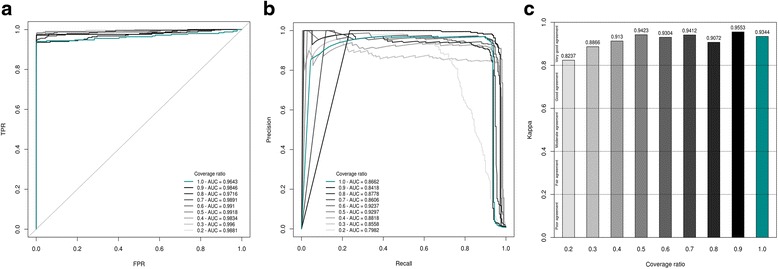
Training assessment of Model 2. The data used to construct these curves were obtained from training phases using Dataset 3 as validation set and either the original Dataset 2 (dark cyan) or an artificial version of Dataset 2 (shades of grey) in which the coverage was gradually subsampled from 10% (ratio of 0.9 ~ 81X; darkest grey) to 80% (ratio of 0.2 ~ 18X; lightest grey) as training set. AUCs are shown for each model. a ROC curves. Solid, dashed and dotted lines represent RF, C4.5 (J48) and SimpleCart algorithms respectively. TPR stands for True Positive Rate and FPR for False Positive Rate. b PR curves. c Cohen’s Kappa coefficient