
Fig. 3.
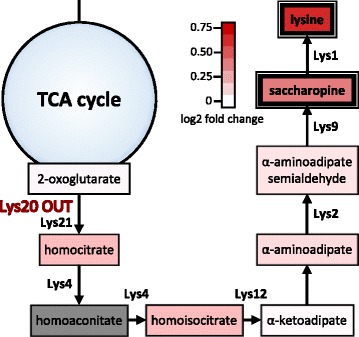
Metabolite level changes in lysine biosynthesis of the Lys20 OUT mutant growing on glucose/proline. Coloring indicates the strength and direction of the fold changes. Significant fold changes are highlighted with a bold frame (p-value < 10−3, absolute log2 fold change > 0.3785). Metabolites in grey were not detected