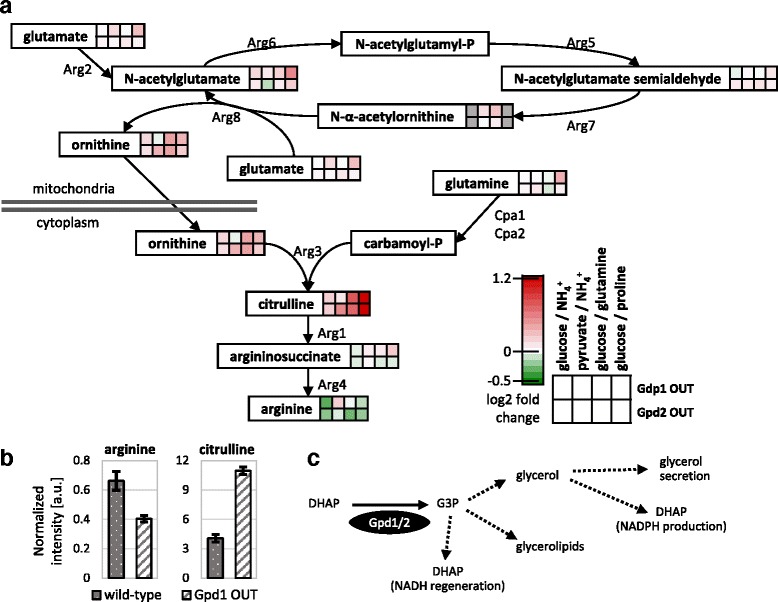
Fig. 6.

Metabolite responses in arginine biosynthesis of the Gpd1 OUT and Gpd2 OUT mutants. a Metabolite response in arginine biosynthesis under all tested conditions. Coloring indicates strength and direction of fold changes. Metabolites in grey were not detected in the respective conditions. Metabolites without color boxes were not detected. b Quantification of arginine and citrulline levels by LC-MS/MS for Gpd1 OUT and wild-type in glucose/NH4 + medium. c Possible metabolic routes for G3P
