
Fig. 4.
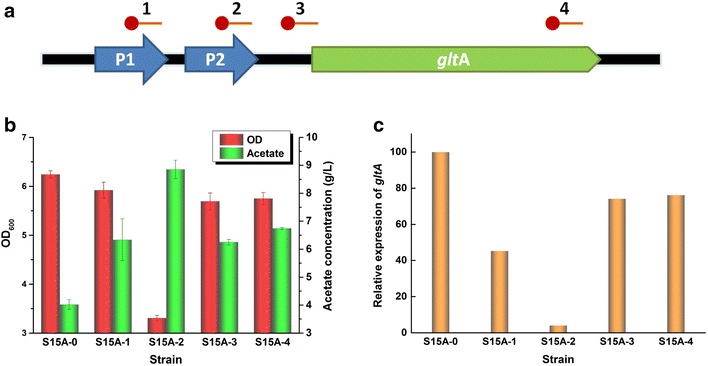
Targeting at different sites on gltA using endogenous CRISPRi. a Spacers targeting gltA on the genome. The red circles indicate the PAM sequence and red lines indicate the spacer. P1 and P2 indicate the two promoters for native gltA. b Cell growth and acetate accumulation by S15A-N. c Transcription variances among different strains with gltA targeted at different sites. The expression of S15A-0 was set to 100, while expression of other strains was calculated relative to this value. Strains were cultured in 50 mL M9 medium containing 1% (v/v) glycerol and 0.2% (g/v) l-arabinose added at 0 h. The error bars indicate the standard deviations of three biological replicates