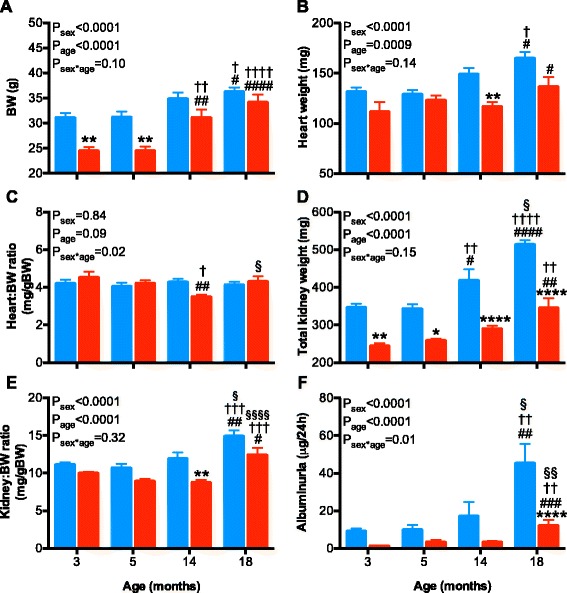
Fig. 6.

Body weight, organ weights, and albuminuria in male (blue bars) and female (red bars) mice at 3, 5, 14, and 18 months of age. a Body weight (BW), b heart weight, c heart weight to BW ratio, d total kidney weight, e total kidney weight to BW ratio, and f albuminuria. Data were analyzed using a 2-way ANOVA with the factors sex, age and their interaction. Tukey post hoc tests were performed where appropriate. *P < 0.05, **P < 0.01, ****P < 0.0001 as compared to age-matched male. # P < 0.05, ## P < 0.01, ### P < 0.001, #### P < 0.0001 as compared to the 3-month-old counterpart. † P < 0.05, †† P < 0.01, ††† P < 0.001, †††† P < 0.001 as compared to the 5-month-old counterpart. §P < 0.05, §§P < 0.01, §§§§P < 0.0001 as compared to the 14-month-old counterpart
