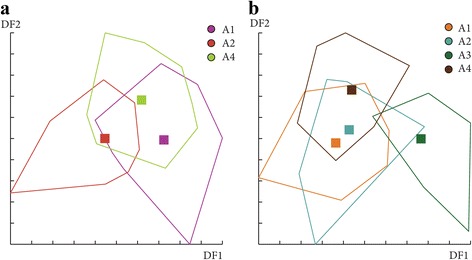
Fig. 11.

Distribution of the individuals along the first two discriminant factors of shape analysis by altitude groups for females (a) and males (b). This distribution was based on the partial warps in June. Horizontal axis: discriminant factor 1; Vertical axis: discriminant factor 2. Altitude groups: 1 (200–300 m), 2 (300–400 m), 3 (400–500 m), 4 (> 500)
