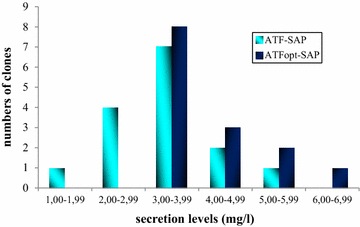
Fig. 3.

Analysis of ATF-SAP expression in Pichia pastoris after codon usage optimization of the ATF domain. Histograms showing the distribution of 14 (ATFopt-SAP, dark blue) and 15 (ATF-SAP, light blue) independent clones induced for 24 h for expression of native or optimized (opt) ATF-SAP. Expression levels are reported in different ranges from the lowest (1.00–1.99 mg/l) to the highest expressers (6.00–6.99 mg/l)
