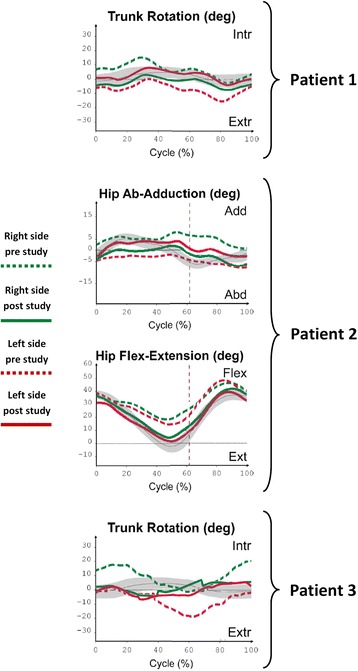
Fig. 4.

Outcomes from kinematic analysis in Patient 1, 2 and 3 without the robotic aid. The graphics show the improvements for each patient depend on the focus of each therapy. Green lines are referred to right side and Red lines to left side. Dashed lines correspond to 3D studies done before the robotic treatment and Continuous lines to 3D studies done after 5 weeks of robot-based therapy
