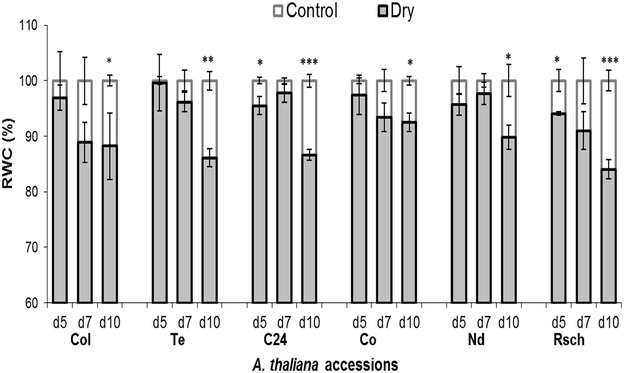
Fig. 2.

A comparison of relative water content (RWC) in leaves of well-watered (control) versus drought-stressed (dry) A. thaliana accessions measured on selected days of drought. Leaves from three different plants were weighted on selected days of drought, and a standard method was used to quantify RWC by measuring fresh weight, turgid weight, and dry weight. The values, given here, are mean from three independent plant leaves ± SE (n = 3). d5 (day 5), d7 (day 7), and d10 (day 10). Asterisks denote significant differences between drought-stressed and well-watered plants (*p < 0.05; **p < 0.01; ***p < 0.001; unpaired t test)
