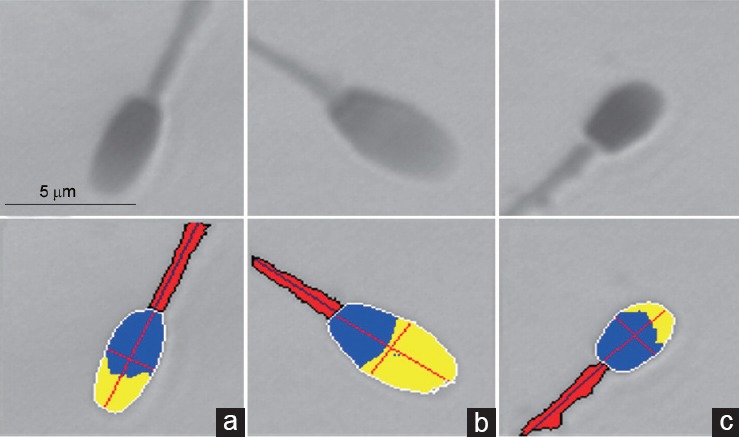
Figure 2.

Puma spermatozoa representing each subpopulation. (a) SP1, elongated shape of intermediate size; (b) SP2, large cells with a high proportion of acrosome; (c) SP3, short and small cells. Upper row, images captured from the microscope; Lower row, digitized images: yellow, acrosome; blue, postacrosomal region (values for head are the sum of both areas); red, midpiece. SP: subpopulation. Scale bar = 5 μm applicable to all images.
