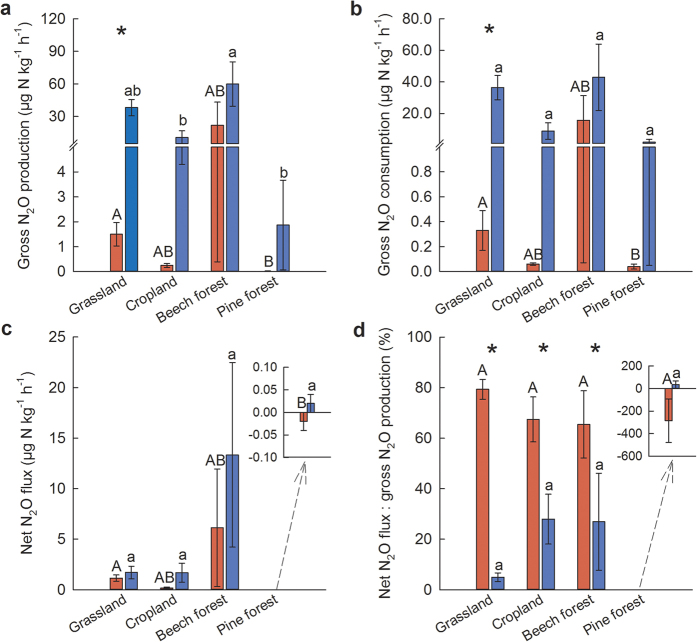
Figure 1. Soil gross and net N2O fluxes.
Gross N2O production (a), gross N2O consumption (b), net N2O flux (c), and the ratio of net N2O flux to gross N2O production (d), measured by 15N2O pool dilution (15N2OPD; red bars) and gas-flow soil core (GFSC; blue bars). For each method, means (± s.e., n = 4 replicate sampling points) with different capital (for 15N2OPD) and small letters (for GFSC) indicate significant differences among sites (one-way ANOVA with Fisher’s LSD test at p ≤ 0.05 or Kruskal-Wallis ANOVA with multiple comparisons of mean ranks at p ≤ 0.05). For each site, asterisks above the bars indicate significant differences between the two methods (paired t test at p ≤ 0.05).

