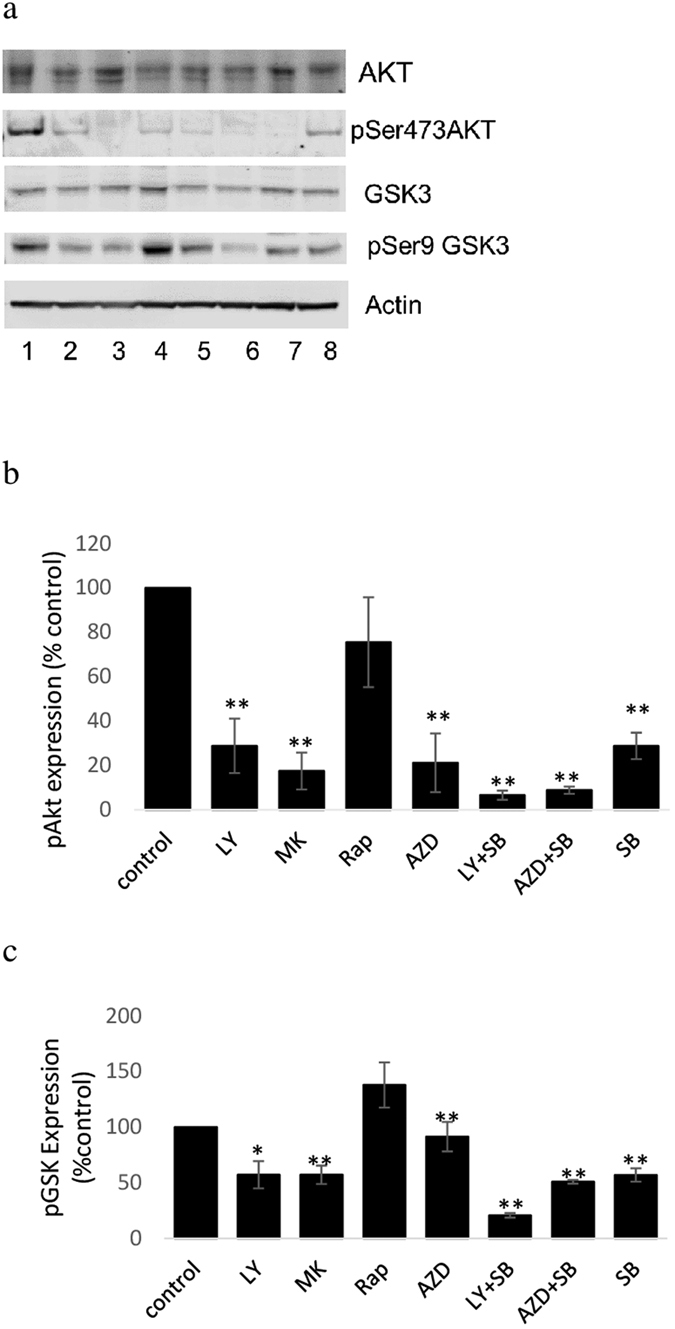
Figure 2. Protein expression of total Akt and GSK3 and their phosphorylation status at Ser473 and Ser9 respectively in lysates of control cells (lane 1), cells treated with LY294002-50 uM (lane 2), MK2206-10 uM (lane3), Rapamycin-20 nM (lane 4), AZD8055-500 nM (lane 5), LY + SB 216367 (lane 6), AZD + SB 216763 (lane 7) and SB 216763 (lane 8) with western blot analysis.

Result is representative (a) or average ± standard deviation (b,c) of three independent experiments. For clarity and conciseness only the gel zones with the bands are shown. No other bands were present on the gels than those shown in the figure. All gels were run under the same conditions (described in the methods section). Full blots for GSK3 and pGSK3 are shown in Supplementary Fig 1.
