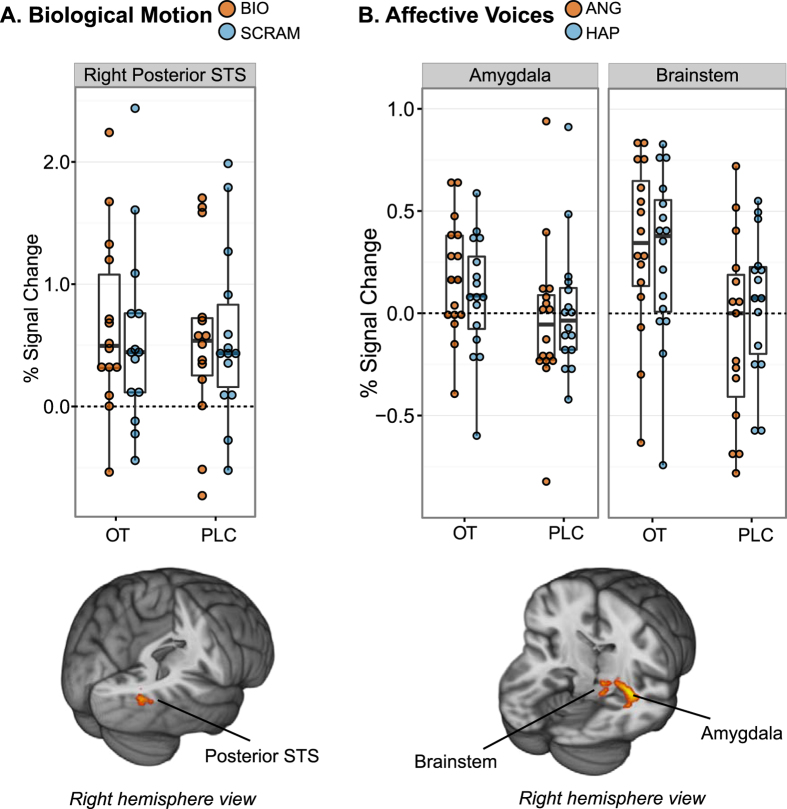
Figure 2. Brain regions in which activation to the experimental contrast of interest was significantly greater under oxytocin (OT) than placebo (PLC).
Main effects of OT administration on brain response to (A) coherent (BIO) versus scrambled (SCRAM) biological motion and (B) angry (ANG) versus happy (HAP) voices are depicted. Results are displayed on the MNI standard brain template, cluster-corrected at p < 0.05 and Z = 2.3. Bar graphs depict group mean percent signal change to each experimental condition, with standard errors.

