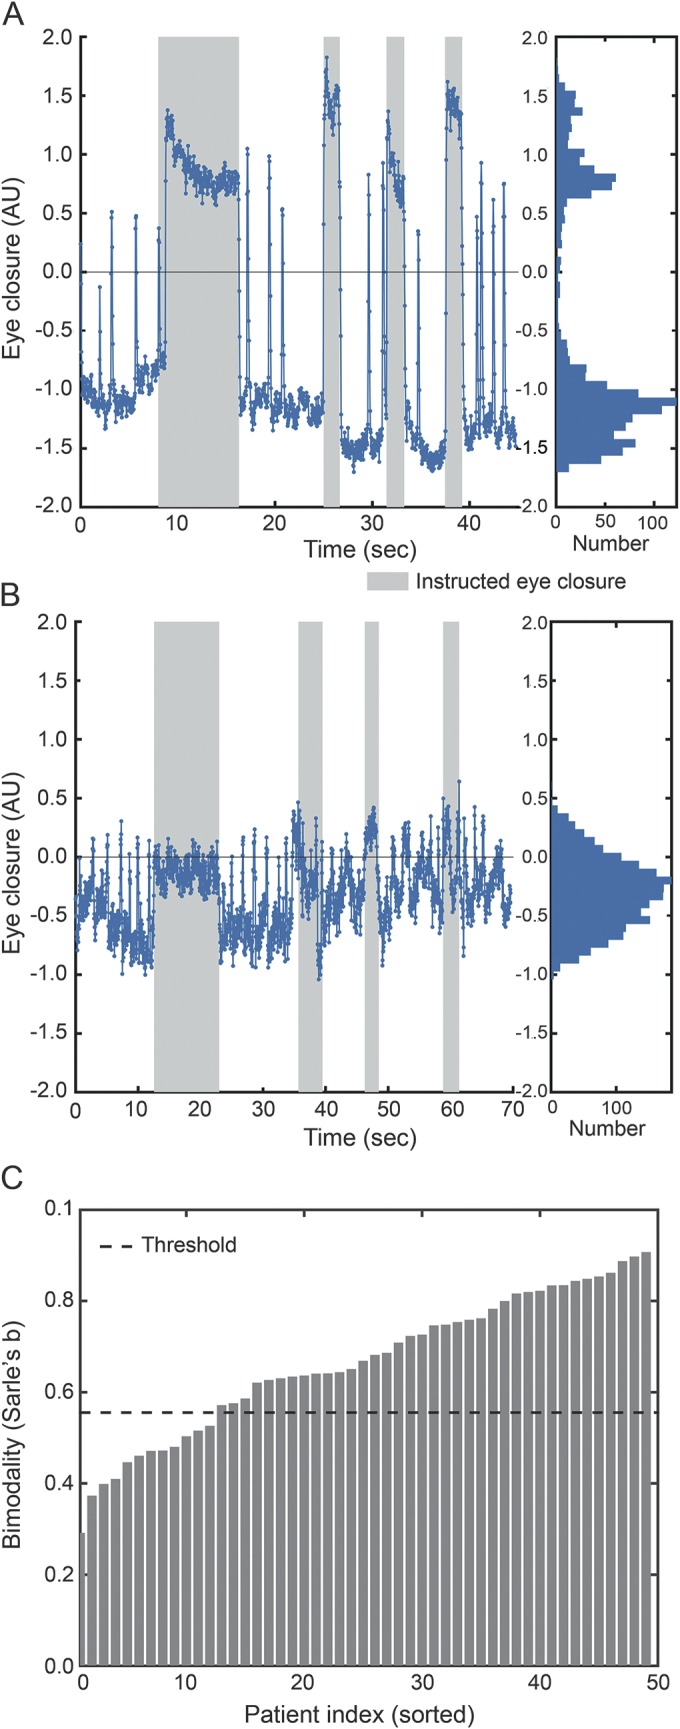
Figure 3. Eye closure thresholding.

Frame-by-frame continuous-valued Computer Expression Recognition Toolbox measures of eye closure during clinical examination, corresponding distributions over time, and bimodality of the distributions. Two sample patients: (A) one with and (B) one without a clear bimodal distribution in eye closure. (C) Bimodality of patients' eye closure distribution (sorted by bimodality measure). Horizontal line represents threshold above which distribution is conventionally considered bimodal (Sarle b, see appendix e-1). BFM = Burke-Fahn-Marsden Dystonia Rating Scale; GDRS = Global Dystonia Rating Scale; JRS = Jankovic Rating Scale. AU = arbitrary units.
