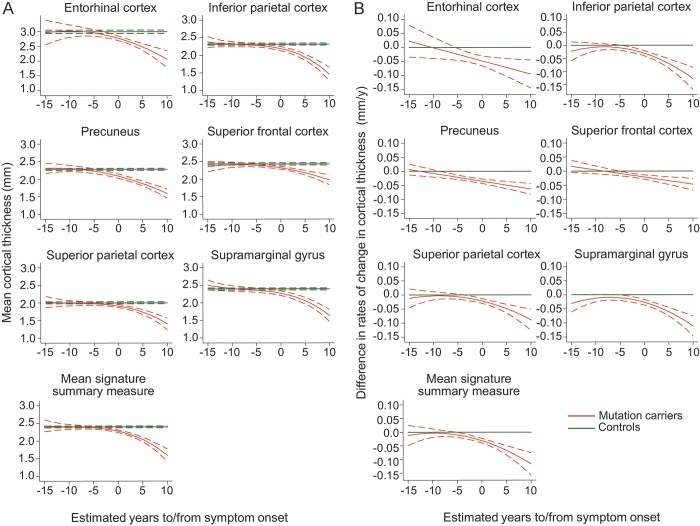
Figure 2. Longitudinal change in cortical thickness in the 6 cortical signature regions.
Graphs compare mutation carriers and controls for (A) absolute cortical thickness value and (B) difference in rate of change in cortical thickness, with the x-axes representing estimated time to/from onset of progressive cognitive symptoms. Graphs are shown for each cortical signature region as well as the mean signature summary measure. Dotted lines indicate 95% confidence intervals.

